Get PolitiFact in your inbox.

A customer checks prices while shopping at a grocery store in Wheeling, Ill., Jan. 19, 2024. A typical basket of groceries now costs 20% more than in February 2021, just before inflation began to take off. (AP)
If Your Time is short
-
Some data in the graphic is inaccurate.
-
The graphic was first posted Sep. 28, 2022, on U.S. Rep. Tom Tiffany’s, R-Wis., X account.
-
Learn more about PolitiFact’s fact-checking process and rating system.
Was the cost of living lower during Donald Trump’s tenure or Joe Biden’s current presidency? A graphic shared on social media tries to answer that question, but its data needs a second look.
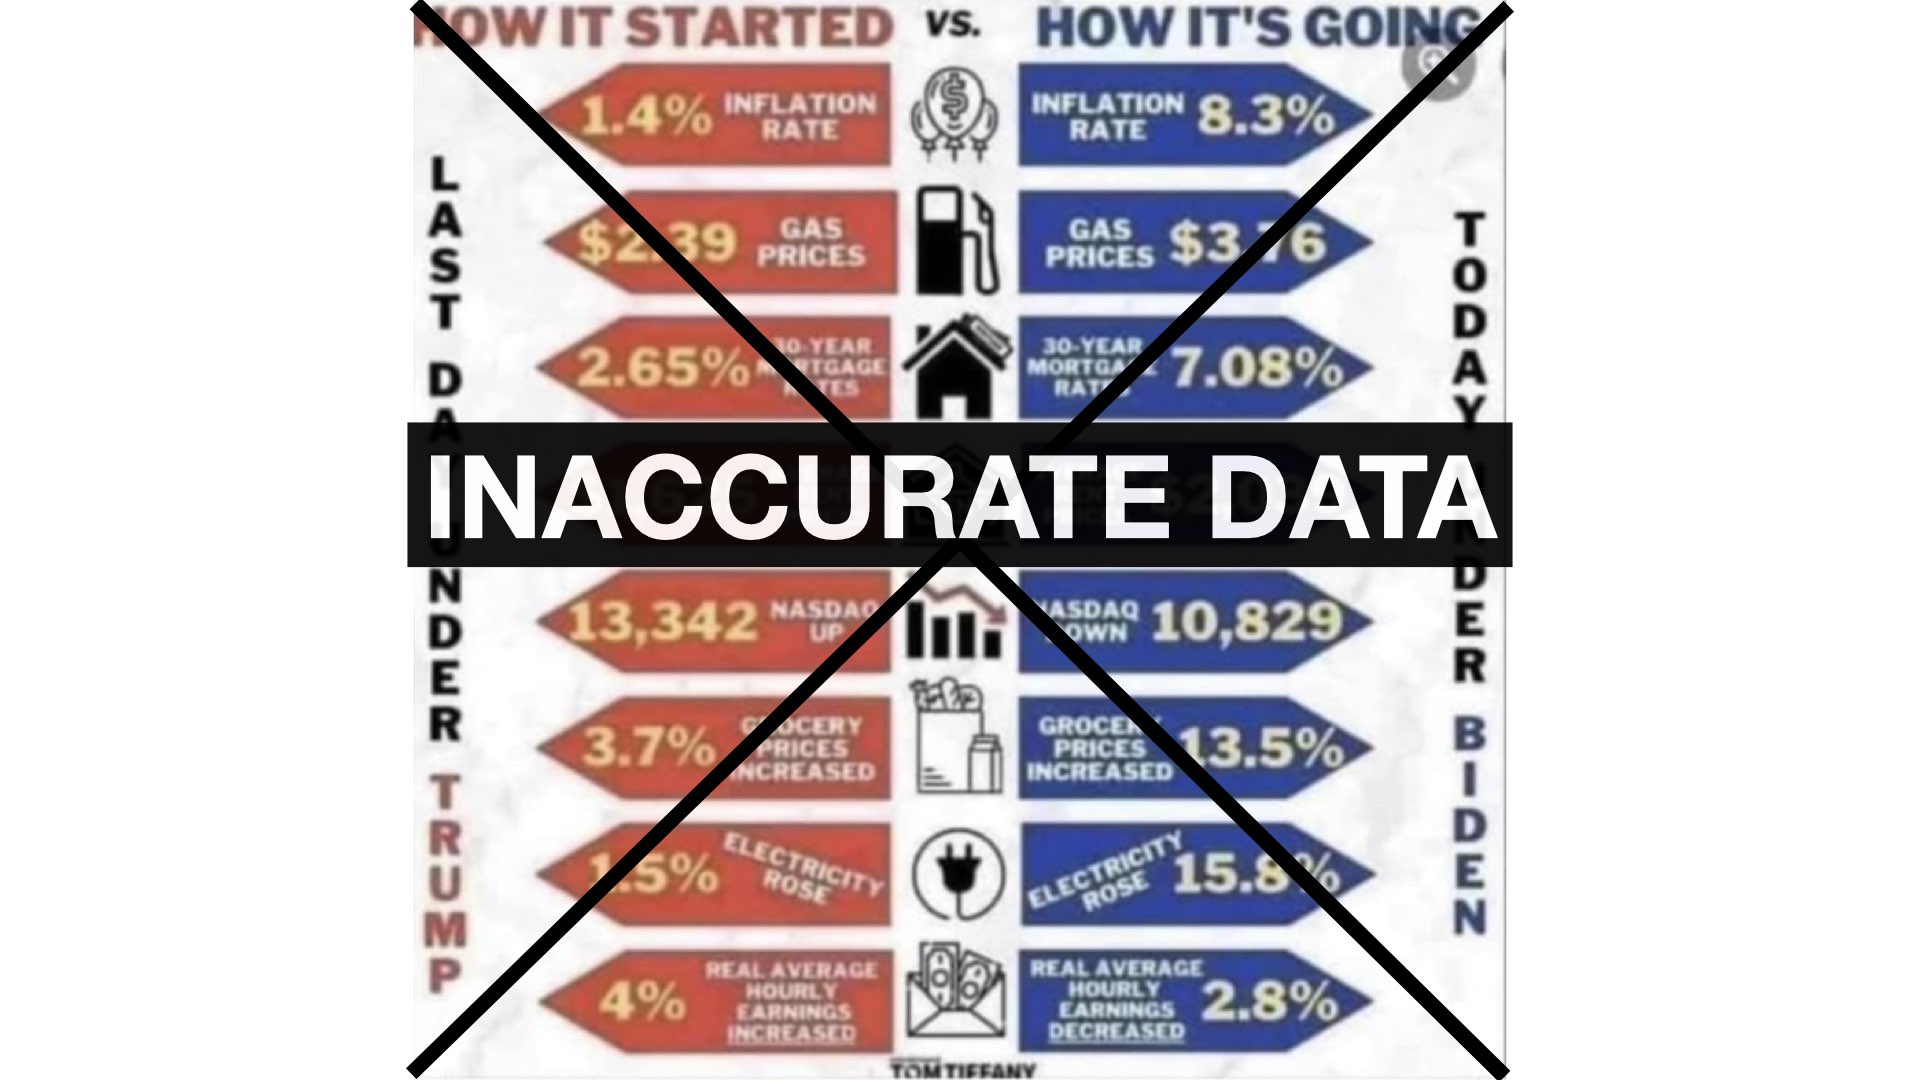
The Facebook image showed two columns: a red one labeled "HOW IT STARTED" for costs on the last day of Trump’s presidency and a blue one labeled "HOW IT’S GOING" for costs during Biden’s presidency "today." According to the graphic, inflation, gasoline prices, mortgage rates, grocery prices and electricity costs have spiked while the Nasdaq composite stock index and "real average hourly earnings" have dropped.
"Just in case you’re sitting on the fence," words atop the March 10 graphic said, followed by an eye-rolling emoji.
This post was flagged as part of Meta’s efforts to combat false news and misinformation on its News Feed. (Read more about our partnership with Meta, which owns Facebook and Instagram.)
(Screenshot from Facebook)
The post does not identify the graphic data’s source, although a watermark at the bottom says "Tom Tiffany." On Sep. 28, 2022, U.S. Rep. Tom Tiffany, R-Wis., shared the same graphic on his X account. It doesn’t accurately reflect what was happening as of January 2021 or March 2024, as the post claims.
Although many consumer prices have risen under Biden’s administration, as of March 10, many of the figures in the post were inaccurate.
CLAIM: The inflation rate on Trump’s last day in office, Jan. 20, 2021, was 1.4%, and it’s 8.3% today.
The graphic is close to reflecting what was happening in 2021 but its 2024 figure is wrong. The inflation rate was about 1.4% when Trump left office and peaked in summer 2022, with Biden as president, reaching about 9% that June. But, by February 2024, the most recent month with available data, the inflation rate was 3.2%, well below the 8.3% claimed in the post.
CLAIM: Gasoline prices were $2.39 per gallon on Trump’s last day and are now $3.76 per gallon.
These numbers are slightly off. The nationwide average gasoline price in January 2021 was $2.42 per gallon, weekly U.S. Energy Information Administration data shows. For the week ending March 11, the average price of a gallon of gasoline was $3.49.
CLAIM: The average 30-year mortgage rate was 2.65% under Trump and is now 7.08%
This is not far off, but it underrepresents the mortgage rate when Trump left office and overstates what it was in early March. The Federal Reserve Bank of St. Louis, which gathers weekly mortgage loan data, reported the average 30-year fixed-rate mortgage was at 2.77% when Trump left office and 6.88% on March 7.
CLAIM: Average rent prices were $1,625 on Trump’s last day and are now $2,039.
The government does not track average national rental prices, but the claim differs from data collected by rental companies.
A market report by Rent, a rental company, found that across the 50 largest cities in America, the national average rental price in February 2024 was $1,981 and in January 2021 was $1,639.
Data from the Apartment List, another website that helps renters find apartments, said that the average national median rent price in February was $1,377 and $1,144 in January 2021. The website’s estimates project rental prices in the future by using data from the Census Bureau’s American Community Survey about people who have recently moved.
Both data sets found that there has been a roughly 18% increase in rent prices between February and the end of Trump’s presidency, not a 23% increase as the post claims.
The site shows that the average rent hasn’t exceeded $2,000 since 2017. In
CLAIM: Grocery prices increased by 3.7% in January 2021 and are now up by 13.5%.
We aren’t sure what time period the post refers to but food prices have risen under Biden along with consumer prices. Overall food prices increased by 5.3% under Trump’s presidency and by 20.4% during Biden’s first three years in office, previous PolitiFact reporting found.
CLAIM: Electricity prices "rose" 1.5% under Trump compared to 15.8% under Biden.
Biden’s administration so far has seen larger increases in electricity prices than did Trump’s. During Trump’s presidency, the national average household electricity price rose by 4.22%, while it has risen by 30% so far under Biden, data by the U.S. Bureau of Labor Statistics shows.
CLAIM: Nasdaq was up 13,342 points when Trump left office and is now down 10,829 points.
This is way off. The Nasdaq composite stock index rose by 7,641 points between the first and last days of the Trump presidency. But the Nasdaq hasn’t fallen during Biden’s presidency; as of March 24, it was up by about 3,231 points.
CLAIM: Real average hourly earnings increased by 4% under Trump and decreased 2.8% under Biden.
Median weekly inflation-adjusted wages for full-time workers increased by nearly 6% during Trump’s presidency, and although they’ve fallen under Biden, the current decline, about half a percent, is smaller than the post says. Given recent trends, the change under Biden is poised to return to zero and then turn positive within months.
PolitiFact has found that price changes are affected by factors other than who is in office, such as Federal Reserve interest rate hikes, global oil price swings and the coronavirus pandemic.
PolitiFact Senior Correspondent Louis Jacobson contributed to this report.
Our Sources
Facebook post (archived), March 10, 2024
X post, Rep. Tom Tiffany, Sep. 28, 2022
PolitiFact, The Biden-versus-Trump economy: Who did better on inflation, jobs, gasoline prices and more? March 4, 2024
Organisation for Economic Co-operation and Development, Inflation (CPI), accessed March 21, 2022
Statista, Monthly 12-month inflation rate in the United States from February 2020 to February 2024, accessed March 21, 2022
Forbes, Today’s Gas Prices by State, March 22, 2024
Federal Reserve Bank of St. Louis, 30-Year Fixed Mortgage Average in the United States, accessed March 22, 2022
Apartment List, Apartment List National Rent Report, Feb. 28, 2024
Apartment List, Data & Rent Estimates, accessed March 22, 2024
U.S. Department of Agriculture Economic Research Service, Food Price Outlook, Feb. 23, 2024
U.S. Department of Agriculture Economic Research Service, Food Price Outlook, Feb. 25, 2021
U.S. Energy Information Administration, In most U.S. regions, 2024 wholesale electricity prices will be similar to 2023, Jan. 18, 2024
U.S. Energy Information Administration, During 2021, U.S. retail electricity prices rose at fastest rate since 2008, March 1, 2022
Nasdaq, Stock Market News for Mar 10, 2023, March 10, 2023
Nasdaq, Stock Market News for Jan 20, 2021, Jan. 20, 2021
U.S. Bureau of Labor Statistics, Real Earning Summary, Feb. 13, 2024
U.S. Bureau of Labor Statistics, Real Earning Summary, Feb. 10, 2021
U.S. Bureau of Labor Statistics, Consumer Price Index Summary, Feb. 13, 2024
U.S. Energy Information Administration, Petroleum & Other Liquids, March 18, 2024
PolitiFact, Donald Trump exaggerates food inflation under Joe Biden; prices are not 40% to 60% higher, Feb. 13, 2024


