
Our only agenda is to publish the truth so you can be an informed participant in democracy.
We need your help.


In the coming weeks, U.S. Sen. Mark Warner and a bipartisan group of five colleagues are expected to introduce a tough-love plan for lowering debt that they promise will make everyone angry.
Warner says his "Gang of Six" will propose an array of tax increases and spending reforms to entitlement programs such as Medicare, Medicaid and Social Security that would slice the national debt by $4 trillion over the next 10 years. He has been laying out the case for more taxes and less spending for months, calling the debt "a ticking time bomb."
Warner appeared on "Face the Nation" on April 17 and told CBS newsman Bob Schieffer: "Right now we are spending at an all-time high; close to 25 percent of our GDP [is] being spent on the federal government. But our revenues are at an almost all-time low of about 15 percent [of GDP]."
We wondered if he was right.
GDP, or gross domestic product, is the measure of the total size of the U.S. economy during a given year. The Department of the Commerce has been tracking GDP since 1929.
The Department of Treasury has been computing the size of government spending and revenues relative to GDP since 1940. It’s data backs up Warner’s contention. Rarely has government revenue been such a small portion of GDP, and rarely has spending been such a large chunk of the total economy.
Let’s start with revenue. Ninety-three percent of federal receipts come from taxes on personal income, corporate income and payrolls.
Uncle Sam took in $2.16 trillion during fiscal 2010, which ended Sept. 30. Revenues equaled 14.9 percent of GDP. In 2009 revenue was $2.11 trillion, again 14.9 percent of GDP.
So both of those figures are close to the 15 percent mentioned by Warner. How do they compare to the past 70 years?
The average since 1940 is 17.4 percent, and the average during the past 30 years is 18 percent. We found that revenue has not been below 15 percent of GDP since 1949 and 1950, when it checked in at 14.5 percent and 14.4 percent.
During those post-World War II years, taxes were cut and the nation enjoyed rapid economic expansion. Medicare and Medicaid did not exist. There were 16 workers for each Social Security recipient, as compared to 2.9 workers per recipient today.
The only other time where revenue was below the 15 percent level was 1940 through 1943, when the U.S. ran massive budget deficits to fund World War II.
So Warner’s right when he says federal revenues "are at an almost all-time low." The revenue totals for 2009 and 2010 were the lowest percentage of GDP in 60 years.
Now let’s look at spending.
The federal government spent $3.46 trillion in fiscal 2010 fiscal year, down slightly from $3.52 trillion in the 2009 budget year. The 2010 figure was 23.8 percent of GDP, and the 2009 figure was 25 percent of GDP.
Those numbers are above historical averages. Since 1940, federal spending has averaged 20.5 percent of GDP, and since 1981 the average is 21 percent.
Spending under George W. Bush ranged from 18.2 percent in 2001 to a high of 20.7 percent in 2008. From 1980 through 2000, spending mostly ranged between 20 percent and 22 percent of GDP.
Only during World War II did expenditures climb above Warner’s 25 percent threshold. It peaked at 43.6 percent in 1943 and 1944 as the U.S. financed much of its global war efforts with debt. By 1946 the figure was down to 24.8 percent, and in 1948, spending fell to 11.6 percent of GDP.
Let’s wrap up.
Mark Warner said government revenue is close to an all-time low at 15 percent of gross domestic product, while spending is at 25 percent of GDP, which Warner says is an all-time high.
Revenue levels -- 93 percent of which come from taxes -- haven’t been this low in 60 years. So Warner is right.
He also aces the spending side. The U.S. has only seen government outlays chew up this much of GDP once in history, at the height of World War II.
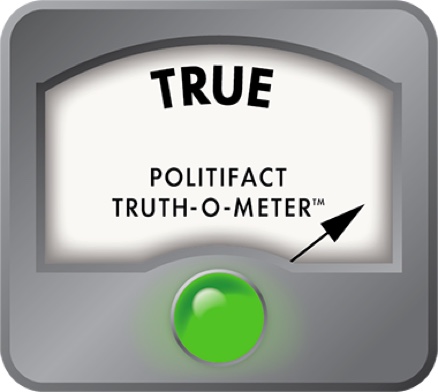
We rate this statement True.
CBS, Face the Nation, April 17, 2011.
CBS, Face the Nation transcript, April 17, 2011.
White House and Treasury Department, U.S. spending and receipts relative to GDP, 1940-2016, accessed April 20, 2011.
Department of Commerce, Annual GDP, 1929-2010, accessed April 20, 2011.
Social Security Administration,Covered workers and beneficiaries: Calendar Years 1945 - 2085, accessed April 11, 2011.
PolitiFact Georgia, Va. Senator says fewer workers supporting more Social Security retirees, April 12, 2011.
In a world of wild talk and fake news, help us stand up for the facts.