Stand up for the facts!
Our only agenda is to publish the truth so you can be an informed participant in democracy.
We need your help.
I would like to contribute

Sen. Elizabeth Warren, D-Mass., speaks about raising wages during the forum AFL-CIO National Summit Jan. 7.
Warren: the average family in the bottom 90 percent made more money 30 years ago
Sen. Elizabeth Warren, D-Mass., believes the government’s economic policies over the past few decades have "cut the legs out from underneath America's middle class."
At the AFL-CIO National Summit on Raising Wages Jan. 7, Warren spoke about growing income inequality, particularly since the 1980s, when the "trickle-down economics" policies gained traction under former President Ronald Reagan. She argued that this theory -- that giving tax breaks and other economic benefits to corporations and the wealthy will benefit the poor by improving the economy overall -- hasn’t worked.
Warren, a former law professor and expert on the economic challenges of the middle class, cited a number of statistics to support her point, including: "Well, since 1980, guess how much of the growth in income over the last 32 years -- how much of the growth in income did the 90 percent get? Zero. None. Nothing. In fact, it is worse than that. The average family not in the top 10 percent makes less money today than they were making a generation ago."
We wondered if that was true -- that the bottom 90 percent of earners in America have a lower income than they had more than 30 years ago.
The statistic comes from data compiled by well-known economists Thomas Piketty and Emmanuel Saez, who study income inequality. Their World Top Incomes Database specializes in cataloging the highest level of incomes over time in more than 20 countries.
To check out Warren’s claim, we looked at average income data from 1979 to 2012 for the top 10 percent and bottom 90 percent of earners. (The time frame Warren used in her speech was "a generation," which is vague, but in context it’s clear she’s talking about since the 1980s.) The Saez-Piketty data comes from millions of tax returns filed over the past century.
The data supports her claim. Adjusted for inflation, the top 10 percent of earners in the United States made, on average, $144,418 in 1979 and $254,449 in 2012. That’s about 76 percent growth.
The bottom 90 percent of earners, on the other hand, made $33,526 in 1979 and $30,438 in 2012. That’s a decrease of about 9 percent.
This chart generated on the Saez-Piketty top income database shows the growth of the top 10 percent of earners’ average income over time, compared to the relatively stagnant progression of the bottom 90 percent of earners’ average income.
Compare this to the 30 years prior, where -- according to Saez and Piketty’s data -- the average income for the bottom 90 percent of earners grew alongside the top 10 percent, albeit at a slower pace.
However there is some context to consider. Mainly, not everyone approves of the Saez-Piketty approach to cataloging income.
Their approach uses pre-tax income and includes realized capital gains. Because the richest Americans earn a lot of capital gains and pay a lot of taxes, this arguably magnifies their income.
On the other hand, the approach lowballs the income of lower-level earners -- the bottom 90 percent in this case. The income calculation does not include government payments, such as Social Security, unemployment insurance, food stamps and the earned income tax credit.
Salim Furth, an economist at the conservative Heritage Foundation, also noted that the data looks at "tax units" -- individuals or married couples filing together -- rather than households, which may artificially lower average incomes. For example, a young adult living with his parents are two separate tax units; together they are one household or family. The Saez-Piketty data captures that the young worker has a very small income, but not the fact that he lives in a house with multiple incomes.
Also, tax law has changed over the past 50 years to increase the number of units, Furth said.
Of the general trend in income growth, he said, "Data sources that are more widely used show solid, though not fantastic, income growth for most of the income distribution through 2007. There are big losses in the Great Recession, and then an incomplete recovery since then."
The Congressional Budget Office produced a report in November 2014 showing that the bottom 80 percent of earners (measured by households rather than tax units) saw income increases of about 16 percent between 1979 and 2011. The top 81-99 percent, on the other hand, saw increases of about 56 percent over the period. And the top 1 percent alone saw their household income grow 174 percent.
That report also found that if it includes government benefits in its income calculation, all income brackets saw even more income growth.
Still, this data shows that top earners’ incomes are growing at a faster pace than everyone else’s -- which supports Warren’s broader point.
Richard Burkhauser, an economist at Cornell University, pointed us to a paper he co-wrote on income inequality that compares Saez-Piketty-style data to other income measurements. The results are consistent with the Saez-Piketty data until households are adjusted for size, and capital gains taxes and government payments are factored in. With those controls, incomes have grown across the board, and income inequality has also grown -- but not at as dramatic a rate as the Saez-Piketty data implies.
Ultimately, Burkhauser’s report concludes that different measurements work for different policy questions.
If Warren’s talking specifically about market income -- that is, income earned before taxes and before government payments -- the Saez-Piketty data "is appropriate, and undoubtedly income inequality has grown substantially in recent years, and the middle class is struggling."
If the question is, alternatively, whether government programs are doing something to close the gap and help the middle class -- other measures show that programs like food stamps and Medicaid are helping to a certain extent, at least for people who qualify. (And of course not everyone in the bottom 90 percent of earners does qualify.)
Arguably, in a speech directed at working and middle-class Americans at a summit on raising wages, the context of Warren’s remarks give credence to the fact that she was referencing data that emphasizes earned income over government-provided income.
In the speech, Warren wasn’t advocating for new government programs that give out payments to individuals in need. She was making a policy argument against the idea of trickle-down economics and in favor of broad economic policies that she believes would improve Americans’ job-earned income, like raising the minimum wage and breaking up the Wall Street banks.
"We can make new choices," she said. "And one way to make those choices is to talk openly and honestly and directly about work, about how we value work, and how we value those who do the work."
Our ruling
Warren said, "The average family not in the top 10 percent makes less money today than they were making a generation ago."
According to one measurement, the bottom 90 percent of American earners had a lower income in 2012 than they had 30 years ago.
By other measurements -- mainly ones that include government payments such as Social Security -- incomes have grown across the board. However, this data still supports Warren’s overall point that income inequality is growing.
Additionally, given the context of her speech at a forum about wages, it makes sense that Warren would reference data that gives more weight to pre-tax income. She’s arguing that middle-class wages haven’t increased enough over the past couple decades.
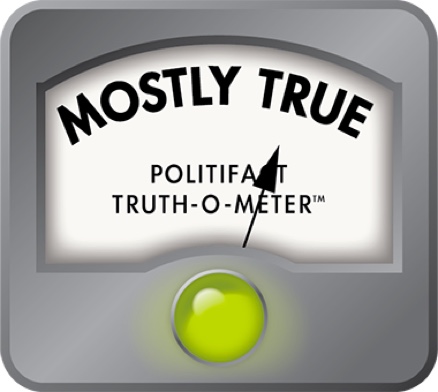
We rate Warren’s claim Mostly True.
Our Sources
AFL-CIO, Warren speech, Jan. 7, 2015
Congressional Budget Office, "The Distribution of Household Income and Federal Taxes, 2011," November 2014
World Top Incomes Database, accessed Jan. 8, 2015
PolitiFact, "Tanden: '95 percent of the income gains in the last few years have gone to the top 1 percent,’" April 27, 2014
PolitiFact, "Ian Bremmer compares big gains for top 1 percent to stagnation for bottom 99 percent," Jan. 7, 2014
New York Times, "The Fight Over Inequality," April 22, 2012
New York Times, "The Rich Get Richer Through the Recovery," Sept. 10, 2013
National Bureau of Economic Research, "Levels and Trends in U.S. Income and its Distribution: A Crosswalk from Market Income towards a Comprehensive Haig-Simons Income Approach," June 2013
Interview, Warren spokeswoman Lacey Rose, Jan. 8, 2015
Email interview, Cornell economist Richard Burkhauser, Jan. 12, 2015
Email interview, Heritage Foundation economist Salim Furth, Jan. 12, 2015
Email interview, Sheldon Danzinger, president of the Russell Sage Foundation, Jan. 12, 2015
Browse the Truth-O-Meter
More by Lauren Carroll
Warren: the average family in the bottom 90 percent made more money 30 years ago
Support independent fact-checking.
Become a member!
In a world of wild talk and fake news, help us stand up for the facts.


