
Our only agenda is to publish the truth so you can be an informed participant in democracy.
We need your help.


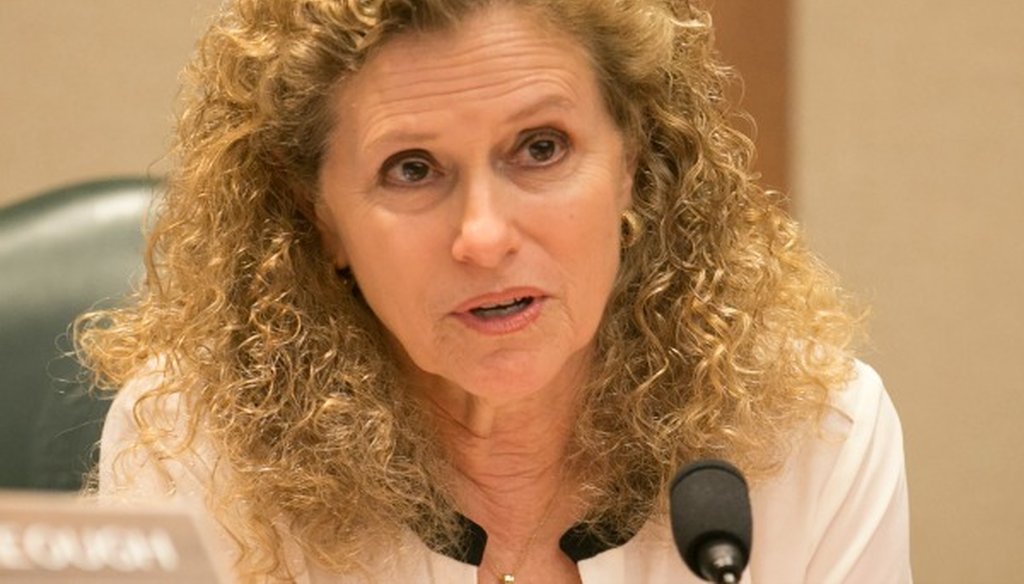
Austin legislator Donna Howard, shown here at a 2016 hearing, made a Mostly True claim about school spending (Austin American-Statesman photo, Jay Janner).
A Democratic legislator maintains lawmakers in 2017 can step up spending on education and other necessities partly by tapping the state’s so-called rainy day fund.
As things stand, Donna Howard of Austin wrote in a September 2016 commentary in the Austin American-Statesman: "Thirty-one percent of school districts are still receiving less funding per pupil than they did prior to the dramatic budget cuts of 2011."
We wondered if that was so.
2011, to refresh, was when the Republican-led Legislature addressed a projected revenue shortfall in part by revising school funding formulas. Those changes and other cuts resulted in school districts getting $5 billion less in state aid through August 2013 compared to what districts likely would have fielded otherwise.
Aide: Howard drew on state prediction
Asked how Howard reached her 31 percent conclusion, Jacob Cottingham in her office told us she relied on a Legislative Budget Board staff projection.
Cottingham forwarded a Sept. 21, 2016, email from Andy MacLaurin, a board manager, containing a splash of the state’s legendarily acronymic funding formulas. M&O refers to school maintenance and operations funding and WADA refers to the "weighted average daily attendance" student counts used by the state to calculate how much a district stands to get in state and local aid, taking into account varied student needs.
MacLaurin wrote that according to the 2015 projection, 31.3 percent of the state’s 1,000-plus school districts "were projected to have a lower M&O revenue per WADA" in fiscal 2016 "than they did in fiscal year 2011 while in fiscal year 2017," MacLaurin said, "23.8 percent of districts were projected to have a lower M&O revenue per WADA than in fiscal year 2011."
So, there’s Howard’s stated 31 percent. Then again, the projection indicated, fewer districts (nearly 24 percent) were expected to get less aid per student in fiscal 2017 (the current fiscal year) compared with 2011.
Also, MacLaurin’s email signaled more analysis to come, stating: "However, please note that these figures are based on the model the LBB has used since the end of last session; this fall, we'll be updating the model with new student counts and property value estimates which are likely to change these percentages."
Next, we followed up with LBB staff spokesman R.J. DeSilva who emailed us district-by-district aid projections behind the information sent to Howard.
DeSilva also noted that the cited projection, developed in May 2015, indicated that on average, school districts were projected to field more aid per student in fiscal 2016 ($6,149) and 2017 ($6,098) than the districts got in fiscal 2011 ($5,734).
Actual spending data
Enough of projections; we hunted up-to-date spending data.
We initially queried the Texas Association of School Boards, which advocates at the Capitol, where Dax Gonzalez referred us to the Texas Association of School Business Officials, which trains school finance and operations professionals.
Later, at our request, Tom Canby of TASBO developed and emailed us a spreadsheet, drawing on audited revenues reported to the Texas Education Agency. The spreadsheet, which adjusted for inflation, indicates that compared with fiscal 2011, 395 of the state’s 1,024 districts, or 38 percent, fielded less state and local funding per student in fiscal 2015, the latest year of available data. Canby said he focused on M&O aid, leaving out aid related to debt service or capital projects. Also, when applicable, he said, he did not take into account "Robin Hood" payments from property-wealthy districts to others as required by law.
We spotted another way to break down the figures. Again adjusted for inflation, the districts fielding less per-student state and local aid in 2015 served 1.1 million students, or 22 percent of nearly 5 million students statewide. Flip side: More than 3.8 million students, 78 percent, attended schools in districts that got more such aid per student.
According to the spreadsheet, the Austin, North East, Frisco, Round Rock and Clear Creek districts were the largest districts that drew less state plus local aid per student in 2015 compared with 2011. Highest-enrollment districts fielding more of such per-student aid in 2015 were the Houston, Dallas, Cypress-Fairbanks, Northside and Fort Worth districts.
Canby, asked why certain districts were getting less aid per student than four years before, replied that how school funding works in Texas is so convoluted, "there is no simple plain English explanation."
Why do some districts get less than before?
We reached a sanded-down explanation after hearing more from Canby and eliciting the detailed emailed analysis of Amanda Brownson, research director for Raise Your Hand Texas, an advocacy group that says it focuses on giving every student access to high-quality public education.
Basically, some districts have remained short of making up for plummets in local revenue touched off by state lawmakers a decade past.
In that 2006 special session, members voted to drive down local school property tax rates as championed by then-Gov. Rick Perry. Lawmakers also agreed to shore up districts by filling the self-created revenue gaps with state aid but that move was accompanied by a stipulation that a district would no longer draw the shore-up or "hold harmless" aid once oft-tweaked state education funding formulas delivered enough money to make up the difference.
One more pivot: in 2011, revenue-strapped lawmakers shaved the shore-up or "hold-harmless" money--a move that remains in effect--delaying full recovery for some districts.
Our ruling
Howard said 31 percent of Texas districts are receiving less funding per pupil than they did prior to the 2011 "budget cuts."
Howard’s assessment was based on a 16-month-old projection while actual results appear to have been worse. Inflation-adjusted data suggest 38 percent of districts fielded less state and local aid per student in fiscal 2015 than before the 2011 reductions.
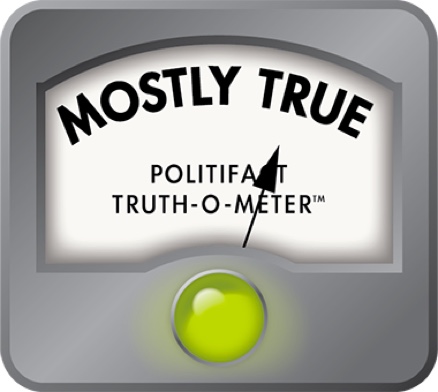
We rate Howard’s statement Mostly True.
MOSTLY TRUE – The statement is accurate but needs clarification or additional information. Click here for more on the six PolitiFact ratings and how we select facts to check.
https://www.sharethefacts.co/share/0c20ef09-f901-426b-bc73-fd3b54a19253
Commentary, "Donna Howard: Painless solutions for the Texas budget," Austin American-Statesman, posted online Sept. 19, 2016
Email, R.J. DeSilva, communications officer, Legislative Budget Board, Oct. 14, 2016
Documents projecting changes in per-student aid for Texas school districts, fiscal 2011 to fiscal 2016 and fiscal 2011 to fiscal 2017, Legislative Budget Board (received by email from DeSilva, Oct. 14, 2016)
Report, "Fiscal Size-up, 2012-13 Biennium," Legislative Budget Board, January 2012
Emails and spreadsheets listing school districts getting more or less aid in fiscal 2015 than in fiscal 2011, adjusting for inflation, Tom Canby, associate executive director for governmental relations, Texas Association of School Business Officials, Oct. 5 and 12-13, 2016
Telephone interviews, Tom Canby, Oct. 6 and Nov. 10 and 14, 2016
Emails, Amanda Brownson, director of research and policy, Raise Your Hand Texas, Nov. 4 and 7, 2016
In a world of wild talk and fake news, help us stand up for the facts.
